

Department of Parks and Recreation
Section 34 · Pages 218–226 · 4 tables · includes narrative
Budget trend
Top expenditures
Top positions by budget
| Title | FTE | 2027 budget | 2026 budget | Per position |
|---|---|---|---|---|
| Recreation Leader 1 | 19 | $872K | $847K | $46K |
| Community Center Director | 10 | $574K | $557K | $57K |
| Recreation Leader, Part-Time | - | $514K | $484K | - |
| Senior Lifeguard | - | $312K | $303K | - |
| First Year Lifeguard | - | $249K | $242K | - |
| Program Coordinator, Special Events | 3 | $172K | $167K | $57K |
| Supervisor, CitiSports | 2 | $157K | - | $79K |
| Headguard | - | $141K | $137K | - |
Key changes
- Budget increases 5.4% ($405K), led by $509K more in personnel-salaries & wages
- Adds 2 positions (55 → 57 FTE)
On this page
Mission
The Department of Parks and Recreation serves to enrich the lives of city residents and visitors through a wide array of programs and events that contribute to a safe and welcoming city where all residents thrive. Specifically, we strive to:
- Create a vibrant community that provides older adults with the social, emotional, and physical resources necessary to be able to stay safe in their home and community.
- Ensure that Pittsburgh’s children & youth have equitable access to quality educational and recreational enrichment opportunities to help them thrive as they enter adulthood.
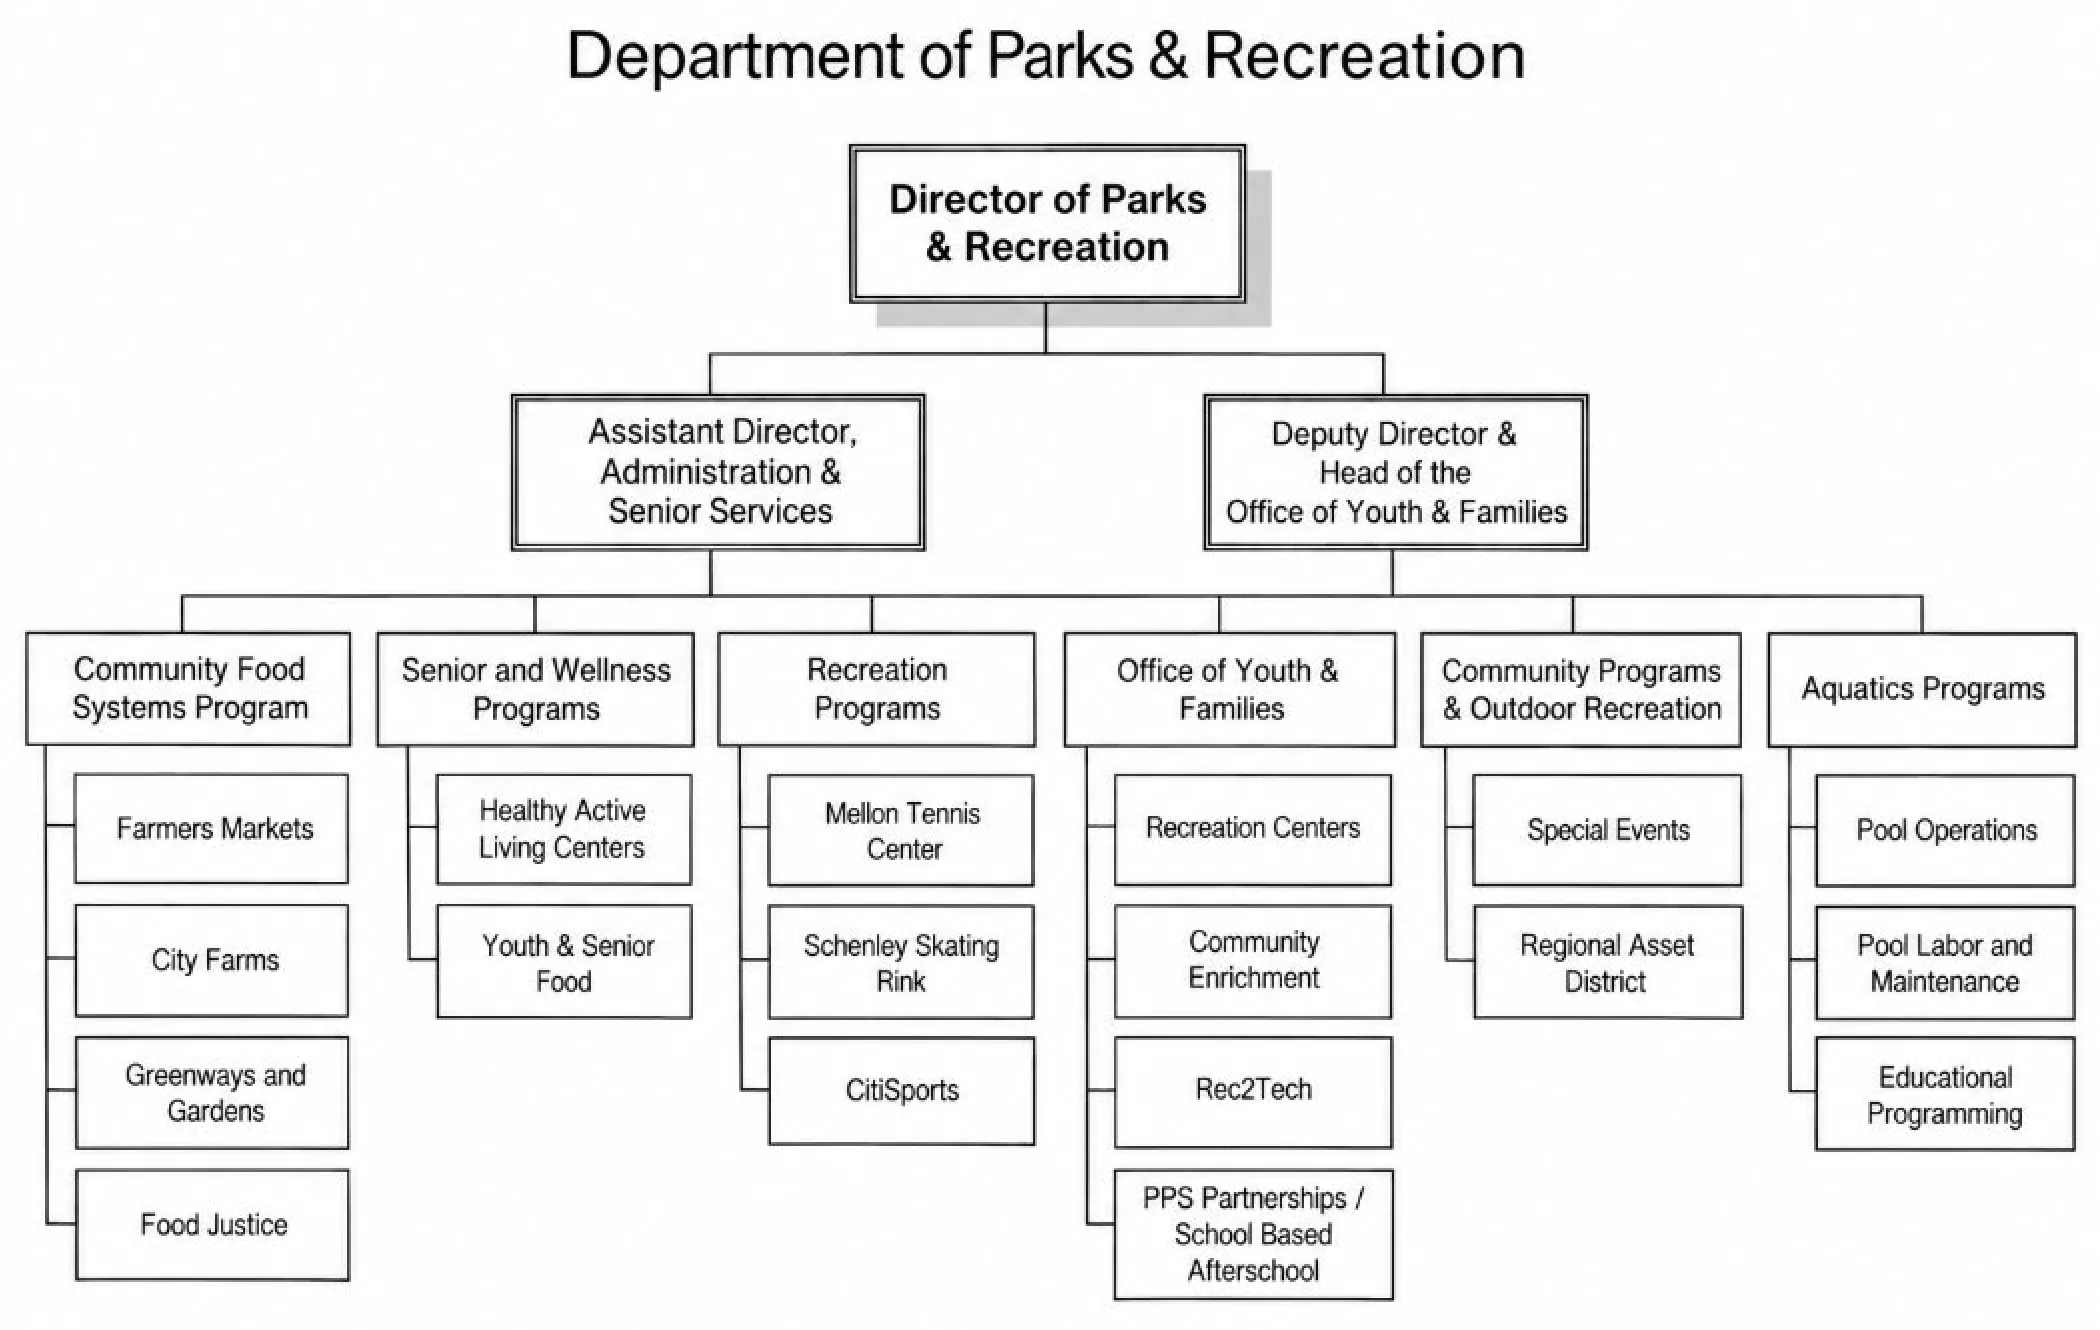
- Utilize our park assets to offer community wide programs and events that strive to be accessible and welcoming to residents and visitors of all ages. Departmental/Bureau Overview The Department of Parks and Recreation accomplishes this mission through four core program areas that are supported by an operations and administrative team. The Operations and Administration division has direct oversight over fiscal and HR processes, planning for capital improvement projects, delivery of new programs and initiatives, and the management of all departmental budgets and trust funds. A critical focus of the Operations and Administration division is to coordinate with other City departments, the Office of the Mayor, City Council, and external partners to ensure effective, efficient, and impactful delivery of programs to the public. Our five core program areas include: Recreation Programs – The Recreation Programs division provides accessible, high-quality recreational and athletic opportunities for Pittsburgh residents and visitors of all ages and abilities. Through CitiSports, the Mellon Tennis Center, and Schenley Skating Rink, the division offers organized sports leagues, instructional programs, and seasonal activities that encourage physical activity, skill development, and healthy lifestyles. These programs foster teamwork, community connections, and lifelong participation in sports and recreation. Office of Youth & Families — The Office of Youth & Families strengthens Pittsburgh's communities by providing accessible, high-quality recreational, educational, and enrichment opportunities for children, youth, and families. Through the City's recreation centers, partnerships with schools and community organizations, and initiatives such as the Roving Art Cart, Alphabet Trail & Tales, and Track n' Treat, the Office creates welcoming spaces and meaningful experiences for residents. The Rec2Tech initiative expands access to technology-focused learning, coding, and digital skill development. As a newly established division, the Office works to improve coordination, consistency, and equitable access to programs and services across Pittsburgh's neighborhoods. Senior and Wellness Programs – The Senior & Wellness Programs division supports the health, well-being, and quality of life of Pittsburgh's older residents through programs and services offered at 12 Healthy Active Living Centers. These centers provide opportunities for physical activity, lifelong learning, social engagement, and cultural enrichment. Through partnerships with community organizations and service providers, the division connects older adults with resources and activities that promote independence, financial well-being, and healthy aging. Food System Programs – The Food System Programs division works to improve food access, strengthen local food systems, and support the nutritional needs of Pittsburgh residents. In addition to providing meal programs for children and older adults, the division operates three City farmers markets, supports urban agriculture through the City Farms Program, and administers the Pittsburgh Food Justice Fund. Together, these initiatives promote food security, expand access to fresh and affordable food, and support a more equitable and sustainable local food system. Community Programs – Community Programs & Outdoor Recreation enhances the quality of life for Pittsburgh residents by activating the City's parks and recreational spaces through engaging events, outdoor activities, and 220
community experiences. The Office of Special Events brings residents together through movies, concerts, races, and signature celebrations, including the Fourth of July and Light Up Night. With support from the Allegheny Regional Asset District (RAD), the City maintains and improves its five regional parks, providing opportunities for outdoor recreation, exploration, and connection with nature. Together, these efforts strengthen community connections and expand access to recreational and cultural experiences.
Aquatics Programs – The Aquatics Programs division provides safe, accessible aquatic facilities and recreational opportunities for Pittsburgh residents of all ages and abilities. The division operates 18 City swimming pools and nine spray parks during the summer months, along with year-round aquatic programming at the Oliver Bath House. Through partnerships with Pittsburgh Public Schools, the division expands access to swimming opportunities and lifeguard training for Pittsburgh youth. Programs such as swim lessons, water aerobics, and competitive swimming promote water safety, physical fitness, and lifelong aquatic skills.
2026 accomplishments
- 149,658 patrons visited the seventeen open city pools during the 2026 summer season.
- Over 75,000 meals were distributed to seniors across the City's twelve Healthy Active Living Center locations.
- Over 300 Pittsburgh youth enjoyed the free City Summer Camp - KidSmart Club - across the City's five participating Recreation Centers.
- Produced over 30 concerts, 47 Movies in the Park, 80 Farmers Markets, a car cruise, and 5 community foot races engaging 18,934 event visitors or participants.
- Welcomed approximately 38,000 attendees and generated an $3.2 million in economic impact, the highest Independence Day July 4 Celebration on record.
Position summary
Lists authorized positions with FTE counts and pay grades.
| Title | 2026 FTE | Rate/ grade | Hours/ months | 2026 budget | 2027 FTE | Rate/ grade | Hours/ months | 2027 budget |
|---|---|---|---|---|---|---|---|---|
| Director | 1 | 35G | 12 | 132,995 | 1 | 35G | 12 | 136,989 |
| Deputy Director | 1 | 33G | 12 | 120,827 | 1 | 33G | 12 | 124,446 |
| Assistant Director of Administration & Senior Programs* | 0.50 | 32G | 12 | 57,023 | 0.50 | 32G | 12 | 58,729 |
| Operations Administrator* | 0.45 | 26G | 12 | 40,473 | 0.45 | 26G | 12 | 41,689 |
| Senior Fiscal & Contracting Coordinator | 1 | 73,426 | 12 | 73,426 | 1 | 75,629 | 12 | 75,629 |
| Administrative Aide | 1 | 52,895 | 12 | 52,895 | 1 | 54,482 | 12 | 54,482 |
| Press Officer | 1 | 17G | 12 | 61,922 | — | 17G | — | — |
| Community Engagement Specialist | 1 | 22G | 12 | 76,294 | 1 | 22G | 12 | 78,582 |
| Program Supervisor, Food Systems | 1 | 22G | 12 | 76,294 | — | 22G | — | — |
| Program Coordinator 3, Farmers Market | 1 | 18G | 12 | 64,542 | 1 | 18G | 12 | 66,477 |
| Food Justice Fund Coordinator | 1 | 14G | 12 | 54,454 | — | 14G | — | — |
| Community Center Director | 10 | 55,702 | 12 | 557,024 | 10 | 57,366 | 12 | 573,664 |
| Manager, Recreation | 1 | 25G | 12 | 86,008 | 1 | 25G | 12 | 88,587 |
| Program Supervisor, Recreation | 1 | 22G | 12 | 76,294 | 1 | 22G | 12 | 78,582 |
| Recreation Leader 1 | 19 | 44,554 | 12 | 846,518 | 19 | 45,885 | 12 | 871,811 |
| Program Coordinator, Recreation | 1 | 55,702 | 12 | 55,702 | 1 | 57,366 | 12 | 57,366 |
| Manager, Special Events | 1 | 25G | 12 | 86,008 | 1 | 25G | 12 | 88,587 |
| Program Coordinator 3, Special Events* | 0.85 | 18G | 12 | 54,861 | 0.85 | 18G | 12 | 56,505 |
| Program Coordinator 3, Special Events | 1 | 18G | 12 | 64,542 | 1 | 18G | 12 | 66,477 |
| Program Coordinator, Special Events | 3 | 55,702 | 12 | 167,107 | 3 | 57,366 | 12 | 172,098 |
| Program Development Coordinator | 1 | 20G | 12 | 70,200 | 1 | 20G | 12 | 72,301 |
| Special Events Administrator | 1 | 15G | 12 | 56,618 | 1 | 15G | 12 | 58,353 |
| Manager, Community Enrichment | 1 | 25G | 12 | 86,008 | 1 | 25G | 12 | 88,587 |
| Program Coordinator, Recreation | 2 | 55,702 | 12 | 111,404 | 2 | 57,366 | 12 | 114,732 |
| Digital Inclusion Coordinator | 1 | 23G | 12 | 79,352 | 1 | 23G | 12 | 81,723 |
| Program Coordinator 3, Aquatics | 2 | 18G | 12 | 129,084 | 2 | 18G | 12 | 132,954 |
| Supervisor, CitiSports | — | 22G | — | — | 2 | 22G | 12 | 157,164 |
| Program Coordinator, Citisports | — | 55,702 | — | — | 2 | 57,366 | 12 | 114,732 |
| Program Coordinator, Afterschool Program | — | 55,702 | — | — | 1 | 57,366 | 12 | 57,366 |
| Total Full-Time Permanent Positions | 55.80 | 3,337,875 | 57.80 | 3,568,612 | ||||
| Temporary, Part-Time, and Seasonal Allowances | — | 1,630,901 | — | 1,797,923 | ||||
| Vacancy Allowance | — | (203,535) | — | (104,917) | ||||
| Total Full-Time Positions and Net Salaries | 55.80 | 4,765,241 | 57.80 | 5,261,618 |
Lists authorized positions with FTE counts and pay grades.
| Title | 2026 FTE | Rate/ grade | Hours/ months | 2026 budget | 2027 FTE | Rate/ grade | Hours/ months | 2027 budget |
|---|---|---|---|---|---|---|---|---|
| Department of | Mellon Park | Senior Citizens Program | Special Events | |||||
| 2027 Allocations | Parks & Recreation | Trust Fund | Trust Fund | Trust Fund | ||||
| Assistant Director | 50% | —% | 50% | —% | ||||
| Operations Administrator | 45% | 55% | —% | —% | ||||
| Program Coordinator 3 | 85% | —% | —% | 15% |
Subclass detail
Compares actual, budgeted and proposed spending across fiscal years.
| 2025 actual | 2026 budget | 2027 budget | Increase/ (decrease) | % change | |
|---|---|---|---|---|---|
| Expenditures | |||||
| 51 - PERSONNEL-SALARIES & WAGES | 4,592,195 | 4,962,005 | 5,471,255 | 509,250 | 10.3% |
| 51101 - Regular | 3,054,148 | 3,134,345 | 3,463,672 | 329,327 | |
| 51111 - In Grade | 124 | — | — | — | |
| 51103 - Part-Time | 1,335,241 | 1,630,901 | 1,797,926 | 167,025 | |
| 51201 - Longevity | 18,750 | 15,250 | 20,250 | 5,000 | |
| 51203 - Allowances | 2,200 | 28,500 | 28,500 | — | |
| 51207 - Leave Buyback | 3,640 | — | 7,898 | 7,898 | |
| 51401 - Premium Pay | 178,091 | 153,009 | 153,009 | — | |
| 52 - PERSONNEL-EMPLOYEE BENEFITS | 1,031,413 | 1,100,576 | 1,374,448 | 273,873 | 24.9% |
| 52101 - Health Insurance | 477,144 | 514,456 | 733,242 | 218,786 | |
| 52111 - Other Insurance/Benefits | 35,598 | 59,733 | 66,675 | 6,941 | |
| 52201 - Social Security | 354,694 | 389,925 | 434,738 | 44,813 | |
| 52301 - Medical-Workers' Compensation | 7,116 | 21,970 | 21,970 | — | |
| 52305 - Indemnity-Workers' Compensation | 38,486 | 1,736 | 1,736 | — | |
| 52315 - Workers' Compensation-Fees | — | 1,655 | 1,655 | — | |
| 52601 - Personal Leave Buyback | 118,375 | 111,100 | 114,433 | 3,333 | |
| 53 - PROFESSIONAL & TECHNICAL SERVICES | 238,068 | 272,900 | 264,700 | (8,200) | (3.0)% |
| 53101 - Administrative Fees | 12,870 | 5,000 | 5,000 | — | |
| 53301 - Workforce Training | 31,399 | 30,000 | 30,000 | — | |
| 53509 - Computer Maintenance | 400 | — | — | — | |
| 53529 - Protective/Investigative | 976 | — | — | — | |
| 53701 - Repairs | 472 | 3,000 | 3,000 | — | |
| 53901 - Professional Services | 120,431 | 134,900 | 96,700 | (38,200) | |
| 53907 - Recreational Services | 71,520 | 100,000 | 130,000 | 30,000 | |
| 54 - PROPERTY SERVICES | 17,984 | 208,500 | 208,500 | — | —% |
| 54101 - Cleaning | 6,638 | — | — | — | |
| 54103 - Disposal-Refuse | — | 500 | 500 | — | |
| 54105 - Landscaping | — | 1,000 | 1,000 | — | |
| 54201 - Maintenance | — | 184,000 | 184,000 | — | |
| 54509 - Vehicles | — | 6,000 | 6,000 | — | |
| 54513 - Machinery & Equipment | 11,346 | 17,000 | 17,000 | — | |
| 55 - OTHER SERVICES | 8,120 | 13,500 | 13,500 | — | —% |
| 55201 - Telephone | — | 3,000 | 3,000 | — | |
| 55305 - Promotional | 1,406 | 500 | 500 | — | |
| 55501 - Printing & Binding | 1,896 | 5,000 | 5,000 | — | |
| 55701 - Transportation | 4,818 | 5,000 | 5,000 | — | |
| 56 - SUPPLIES | 345,778 | 452,500 | 582,500 | 130,000 | 28.7% |
| 56101 - Office Supplies | 7,742 | 15,000 | 15,000 | — | |
| 56103 - Freight | 1,558 | — | — | — | |
| 56151 - Operational Supplies | 336,222 | 412,500 | 542,500 | 130,000 | |
| 56401 - Materials | 256 | 25,000 | 25,000 | — | |
| 58 - MISCELLANEOUS | — | 500,000 | — | (500,000) | (100.0)% |
| Expenditures | |||||
| 58101 - Grants | — | 500,000 | — | (500,000) | |
| Expenditures Total | 6,233,558 | 7,509,981 | 7,914,903 | 404,923 | 5.4% |
Five-year forecast
Projects budget figures across multiple future years.
| 2027 | 2028 | 2029 | 2030 | 2031 | |
|---|---|---|---|---|---|
| Expenditures | |||||
| 51 - PERSONNEL-SALARIES & WAGES | 5,471,254 | 5,557,723 | 5,634,962 | 5,691,922 | 5,748,195 |
| 52 - PERSONNEL-EMPLOYEE BENEFITS | 1,374,448 | 1,408,859 | 1,442,957 | 1,476,101 | 1,482,709 |
| 53 - PROF. & TECHNICAL SERVICES | 264,700 | 264,700 | 264,700 | 264,700 | 264,700 |
| 54 - PROPERTY SERVICES | 208,500 | 208,500 | 208,500 | 208,500 | 208,500 |
| 55 - OTHER SERVICES | 13,500 | 13,500 | 13,500 | 13,500 | 13,500 |
| 56 - SUPPLIES | 582,500 | 582,500 | 582,500 | 582,500 | 582,500 |
| Total | 7,914,902 | 8,035,782 | 8,147,118 | 8,237,223 | 8,300,104 |
| % Change from Prior Year | 5.4% | 1.5% | 1.4% | 1.1% | 0.8% |